USOILWe can attempt to buy USOIL from specified level as it break LH , also bullish divergence occur indicate that it move upward .
SL , TP mention in chart.
Futures market

INT IRL ( PRICE IN DISCOUNT) EXPECT A VALID PULLBACK HTF bias Gold is heavily bullish ,After Breaking structure to the upside price pullback .....only a valid pullback must be in discount zone below the red line.Marked HP is high probability anticipated for the valid pullback though price is in Discount zone.


Can Oil soar on June 2 OPEC+ cut hopes? Can Oil soar on June 2 OPEC+ cut hopes?
WTI crude futures and Brent continue to recover from three-month lows. The rebound is potentially driven by expectations that OPEC+ will extend its output cuts of 2.2 million barrels per day into the second half of the year during its June 2 meeting.
Additional support for crude prices came from the start of the U.S. summer driving season and a weaker dollar.
Further data on the demand side will come from upcoming U.S. PCE to gauge the Federal Reserve's future monetary policy. A softer-than-expected reading on the PCE could increase the possibility of interest rate cuts, and potentially enhance the demand for energy.
Deutsche Bank has maintained its Brent forecast at $83 per barrel for the second quarter and $88 for the second half of the year, assuming OPEC+ will sustain its current production policy on Sunday.
Should prices move above the $80 level, WTI could test the 50-day moving average just above $81.1. The RSI suggests there is still room for prices to rise before reaching the overbought zone. Conversely, if prices fall below the $78 range, they might stabilize around the $76 mark.

Gold Global Analysis
Gold began to correct after the opening yesterday, and it temporarily stopped after hitting a maximum of around 2358 at the end of the US market. However, the upward trend was weak in the morning of the day, and it retreated in the opposite direction. Currently, the European market has retreated to around 2340, and the intraday discontinuity It also allows us to directly consider whether yesterday's retracement was a correction by the shorts, not a counterattack by the bulls. Furthermore, combined with last week's retracement and downward channel, it is not a reversal in the short term, and we still need to continue in the later period. We are short gold, and it is currently retracing above 2340. Overall, the short energy remains during the day, and there is still some room for downside in the evening.
Judging from the current trend of gold, the first support below is maintained at the 2328-30 line, focusing on the 2320 line. This position is also related to whether short sellers can start a new round of action in the later period, while the key suppression port above will remain at 2320. Last week's retracement high point was around 2360-65. This position is also our ideal short selling point in the evening. The hourly line is currently repaired and there is a signal to turn around. In the middle position, watch more and move less and pursue orders cautiously. Wait patiently for the key point. Bit entry.
1. Go short on the rebound at 2350-55, cover the short position at the 2360-65 line, stop loss at 2372, and target the 2338-2340 line;

USOIL - bottom out ? What's next ??#USOIL.. market placed lows around 76 77
And bounced back.. now we have 78 around as a immediate supporting area and if market hold it means further highs are in table.
Keep close it guys and don't be lazy here..
Good luck
Trade wisely

POTENTIAL TOP ON GOLD (XAUUSD) Hey everyone! Coming on here with another breakdown of the commodity Gold! Let's dive in!
OK so what I am seeing is a potential for Gold to actually soon make a move to the downside. What leads me to this conclusion is the fact that first off Gold is sitting around all time highs of $2,450 PER OUNCE for this commodity. Literally never seen before. Now of course Gold is a great hedge against inflation and a weakening US Dollar but prices have to eb n flow for the market to be able to build the liquidity to continue with demand in prices. So based on how last week had closed with price you can see an attempt to go higher above that $2,450 per ounce mark but shortly after getting slammed to the downside with very very strong seller momentum...price too expensive...right now. SO what that had caused technically was a bearish engulfing weekly candle...and a very strong push to the downside on the daily timeframe as well! AND IF THE #1 SIGN OF A REVERSAL IS POWER...THEN THIS FITS THAT BILL..
Also something you can see is how the buyers are struggling to bring price up (showing weak to minimal demand) supporting the case for further downside to again build demand back up in this every demanding commodity. ALSO on the 4H timeframe we broke lows and are now in a bearish market for some price action confirmation.
OK so keep an eye out when prices come (if they do) back up into that newly developed supply zone for potential move to downside. Cheers!

XAUUSD Outlook👁️ OUTLOOK
5hr chart:
Context 5hr: Price is currently in reaccumulating and needs time to get above the 50 ema. Once price starts surfing the 50ema then I will start looking for longs on Gold.
Analysis summary: Bullish and expecting price to continue to break 2450.125 area this week or upcoming weeks. Needs a bit of time to show money coming in but I will have Gold on my watchlist this week.


GOLD - Will double in price in a few years! (cup and handle)GOLD is at its all-time high levels and will continue in the price discovery action. Why? On the chart, you can see a cap and handle formation that is currently breaking out on the monthly chart. This is a huge event for gold, and therefore the price can double in a few years from now. Does it mean that we will see a multi-year bull market? Definitely yes. This cup and handle formation is fully confirmed. The monthly candle closed above the neckline of this pattern with a bullish engulfing candle.
How to trade? If you are an investor, simply buy gold and hold, you can expect a pretty good and reliable return in a few years. If you are a swing trader, I recommend trading with the trend and going for buy/long only strategies. Do not short gold on futures, as it will lower the probability of success. And if you are a day trader, also focus on long-only strategies, and you can potentially short GOLD, but only with limit orders that you put above the current price. Avoid trading bearish breakouts, as they tend to take liquidity (stop losses) and reverse.
What is the profit target for gold in 2026 or 2030? There is no historical price action, so to determine our profit targets, we need to use the Fibonacci extension tool and Elliott Wave theory with simple trendlines. On the chart, you see my Fibonacci projection (wave 1 -> wave 2). Usually, the market tends to react to the 1.0 extension, the 1.618 FIB extension, and the 2.0 extension. These are strong levels, but only for a short-term bounce. As my title says, I am expecting a huge bull market, so do not forget to follow my account to stay updated!
Let me know what you think about my analysis, and please hit boost and follow for more ideas. Trading is not hard if you have a good coach! Thank you, and I wish you successful trades.

Gold slowing at Thursdays POCI have been testing Tradingviews volume profiles with Gold and some of the levels are so accurate. Using spot market data, it was a bit of a surprise, but a welcomed surprise it has been.
We can see today's intraday longs tapping straight into a naked POC left behind from the sharp sell off on Thursday.
I have yet to test this is in other markets however Gold has proven really quite reliable utilising the entire Value area from the fixed period profiles.
Anyway - watch out for Gold bears to take control once again from 2360 - 2370 once again.
I am looking for a 1000pip drop near enough back to 2275. I will keep you all updated.

Gold money making trading signals
Yesterday's trading idea was to sell gold at 2428-2433. The first target price is 2410. Today it also dropped to the target price as expected.
Let me talk about the current market situation, pay attention to the downtrend line in the picture, I wanted to see this trendline continue to decline yesterday and then drop to 2380 or even lower, because after the high point appeared at 2450, it was 2437. The top came down From the pressure of the lower conversion level, but the decline did not correspond to a 100% decline and the last point was around 2397. Since it has reached the decline stage, I will combine the second conversion from the top and bottom to. 2425. That's right, and over time, 2425 is already a compression site close to the trend line, so it's reasonable why the decline would go to 2337? Because this is the previous high point, I had already predicted that if gold breaks the downtrend line, it might bounce back. It will almost certainly go higher again, as you can see, it is just a horizontal shift that has been broken, but you have to do a good job of bouncing to prevent this kind of hasty behavior. .
2435 is the starting and falling center for the US market yesterday, and it was in a very good condition at the beginning of the decline, which made it clear that it will challenge 2400 points again. It can also be viewed as an equidistant channel and is now in a state of falling by half, meaning that the standard target is located near The lower edge of the channel is below 2405. Assuming gold swings higher again, the upper edge of the channel. Channel 2430 is the best bearish position, stop loss is 2440, we continue to look at the target of 2400 points.
Overall, let's look at the 2400 level today, it doesn't matter if it is broken or not, I don't think too much about it, just set the target little by little.

XAUUSD Trade ideasLast week, the 2420-2425 range served as a strong resistance, pushing gold down to 2325. The 2325 level held as strong support, offering potential for a reversal to 2365, 2385, 2415, and potentially 2450. However, if gold falls below 2325, it could open the way for declines to 2310, 2285, 2255, and possibly 2100.

BRENT. Weekly trading levels 27 - 31.05.2024During the week you can trade from these price levels. Finding the entry point into a transaction and its support is up to you, depending on your trading style and the development of the situation. Zones show preferred price ranges WHERE to look for an entry point into a trade.
If you expect any medium-term price movements, then most likely they will start from one of the zones.
Levels are valid for a week, the date is in the title. Next week I will adjust the levels based on new data and publish a new post.
! Please note that brokers have a difference in quotes, take this into account when trading.
The history of level development can be seen in my previous posts. They cannot be edited or deleted. Everything is fair. :)
----------------------------------------------
I don’t play guess the direction (that’s why there are no directional arrows), but zones (levels) are used for trading. We wait for the zone to approach, watch the reaction, and enter the trade.
Levels are drawn based on volumes and data from the CME. They are used as areas of interest for trading. Traded as classic support/resistance levels. We see the reaction to the rebound, we trade the rebound. We see a breakout and continue to trade on a rollback to the level. The worst option is if we revolve around the zone in a flat.
Do not reverse the market at every level; if there is a trend movement, consider it as an opportunity to continue the movement. Until the price has drawn a reversal pattern.
Don't forget to like Rocket and Subscribe!!! Feedback is very important to me!

USOIL WTI: Bullish Momentum Ahead? - May 8, 2024Hey traders! 📈 Let's discuss the current outlook for USOIL WTI:
🔍 Technical Insight:
We've observed a compelling development in the WTI market as it recently touched the lowest point within the current uptrend channel, dipping below the golden pocket levels. This move prompts a closer examination of the prevailing market dynamics.
📊 Daily Timeframe Perspective:
Zooming out to the daily timeframe, the overarching trend remains bullish, reflecting the resilience of the oil market. However, it's crucial to note that a consolidation phase appears to be underway. Such periods of sideways movement often precede significant price actions.
🔄 Awaiting Breakout Momentum:
One notable aspect in recent days is the absence of substantial price movements, typically characterized by WTI's propensity for $3 or greater swings. This prolonged consolidation phase suggests that a significant move may be expected in the upcoming days.
💡 Anticipated Market Activity:
Given the historical tendencies of WTI, we anticipate a breakout from this consolidation phase in the near future. Such a move could potentially signal the resumption of bullish momentum or a reversal in the prevailing trend.
📈 Trading Strategy Consideration:
For traders, exercising patience while monitoring price action for signs of breakout momentum is paramount. Deploying appropriate risk management strategies and remaining adaptable to evolving market conditions can help navigate uncertainty.
🔔 Key Takeaway:
As we await clarity on WTI's next directional move, it's essential to stay vigilant and prepared to capitalize on emerging opportunities. Whether it's a continuation of the uptrend or a reversal, flexibility is key to navigating the dynamic oil market.
🛢️ Closing Thoughts:
In conclusion, while the current consolidation phase may signal a temporary lull in market activity, the potential for a significant move looms on the horizon. Keep a watchful eye on price developments and be ready to adjust your trading strategy accordingly.

THE KOG REPORT - UpdateEnd of day update from us here at KOG:
As suggested in yesterdays update we were looking for the support level 2340 to hold price up and then for a push upside into the 2350, 2355 and above that the 2360-65 region. Excalibur guided on top of that giving us a precise entry level together with the red box strategy hitting not only our daily bias targets but also the Excalibur targets that activated.
So, what now?
As long as this support level keep the price up with the extension into 2335 we feel gold is looking for higher pricing. We have the KOG Report level which is a little higher than where we are so continue with the plan for now looking higher to potentially take that short trade. For now, it's playing a smaller range and it's expected to start whipsawing traders leading up to the last days of the month.
As always, trade safe.
KOG

XAUUSD:28/5 Today’s Analysis and StrategyGold technical analysis
Daily resistance is 2370, support below is 2327
Four-hour resistance is 2370, support below is 2327
Gold operation advice: Yesterday, the overall price of gold stabilized above 2330 in the short term. However, the current hourly line and 4-hour chart are still in the downward rhythm of short pressure. The 4-hour level still sees a suppressed and volatile operating rhythm until it reaches the 2400-point integer mark.
Judging from the current trend, today's short-term pressure will focus on 2370. During the day, counterattacks will rely on this position to be bearish. The short-term support below will focus on around 2340. Today, the overall focus will be on selling high and buying low in the 2340-2370 area, and trade cautiously in the middle position.
SELL:2370near
SELL:2360near
BUY: 2340near
Technical analysis only provides trading direction!

Gold’s rebound is a good opportunity to go shortAfter overnight short orders hit TP: 2343 this morning, gold has been fluctuating within the 2340-2345 area. Judging from the current gold trend, the downward trend of gold has slowed down, and it has rebounded again in the short term and exceeded the 2340-2345 area. But the weak situation has not changed.There are two voices in the current market. One is that gold has stopped falling and stabilized in the short term, and may continue to rebound, and may even hit 2400 again. The other voice is that gold’s rebound is weak and there is still room for decline.It may continue to fall to around 2300 after consolidation.
In fact, relatively speaking, I think gold cannot be characterized as a market reversal for the time being, but only a short-term rebound after the market crash. As evidenced by the fact that gold fell again after touching around 2357 today.Judging from the current trend, gold currently tends to fluctuate, but as far as the restorative market is concerned, the repair intensity is still lacking, so it is still not ruled out that gold will continue to fall after the shock;In addition, from the perspective of the U.S. dollar index, the U.S. dollar index has fallen significantly, while the short-term rebound of gold is far less than the decline of the U.S. dollar index, so the overall gold appears to be weaker. And as gold falls back to the 2340 area again, the upper pressure is stronger, so I expect gold’s short-term rebound to be limited.
So in terms of trading, I still tend to short gold after gold rebounds. The first thing to focus on is the 2360-2370 resistance area, especially the 2365 position area, which is a strong defensive area for short sellers. Below, we are still focusing on the 2335-2330 support area for the time being. This area is the starting point of the two rebounds and has a strong short-term support effect. However, any time this area is broken, it will be conducive to the outbreak of shorts!

A "cup" of CoffeeMoving averages displaying a classical uptrend, with the 100MA proving to the bulls as support.
Above average volume on key pivotal zones, along with today's strong close leads me to believe the trend is fully intact and caffeinated for another leg upwards.

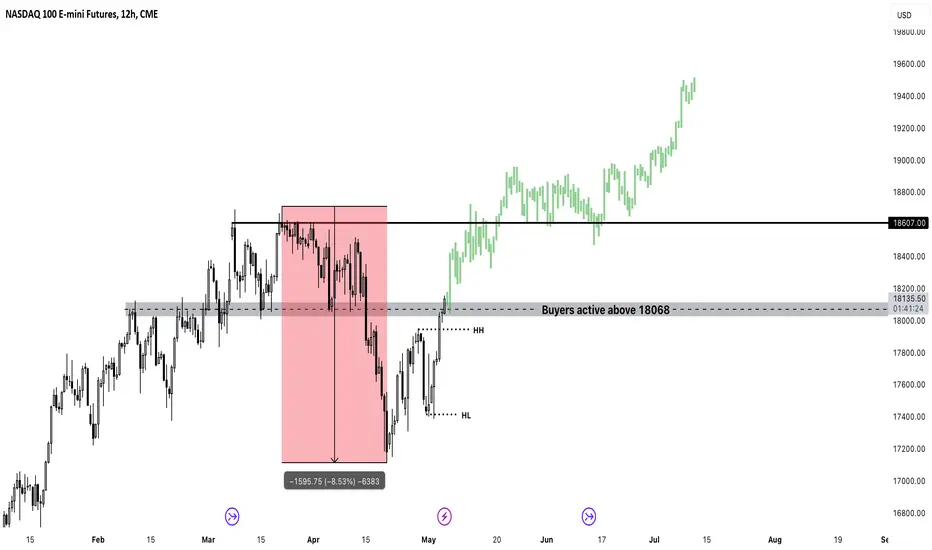
NASDAQ Uptrend Continuation Nasdaq 100 has fallen by 8.53% since its previous high.
The market has now created a new higher high and higher low signalling strong bullish momentum. If price can stabilise above 18608, we can see price target all time highs.
Natural Gas every 4 years The natural gas markets have broken above the crucial $2 level, and it looks like we are probably going to continue to go higher. All things being equal, the short-term pullback should be buying opportunities that we take advantage of. This is an investment. This is not a short-term smash and grab trade. Keep in mind that supply is still a major issue with natural gas, but perhaps people are starting to realize that there’s natural gas in the Middle East and maybe geopolitical issues come into the foray and drive prices higher.
Nonetheless, I don’t think this is a long-term issue. I do think that you’re looking to buy dips in a lowly levered position, in my case an ETF, and just hanging on to it for the majority of the year as an investment. I think we could go for $2.50, but it’s going to take a while.
Credit: Christopher Lewis - FX Empire

GOLD 4H CHART ROUTE MAP UPDATEHey Everyone,
Another great day on the market today completing our 4H chart idea bullish target.
This chart was shared on Sunday with 2361, as an open target. This target was completed today with a perfect hit.
We now need to see ema5 lock above 2361 to open the next target. Our 1h chart has a gap open to 2365, which was just short by a few pips. We will keep this in mind, as we track both charts.
As stated above we will need to see ema5 lock above 2361 to further open the range above or a rejection will follow to find support in the retracement range. A cross and lock below 2290 will open the swing range.
We will keep the above in mind when taking buys from dips. Our updated levels and weighted levels will allow us to track the movement down and then catch bounces up.
We will continue to buy dips using our support levels taking 30 to 40 pips. As stated before each of our level structures give 20 to 40 pip bounces, which is enough for a nice entry and exit. If you back test the levels we share every week in the past 24 months, you can see how effectively they were used to trade with or against short/mid term swings and trends.
BULLISH TARGETS
2361 - DONE
EMA5 CROSS AND LOCK ABOVE 2361 WILL OPEN THE FOLLOWING BULLISH TARGET
2385
EMA5 CROSS AND LOCK ABOVE 2385 WILL OPEN THE FOLLOWING BULLISH TARGET
2416
BEARISH TARGETS
2322
EMA5 CROSS AND LOCK BELOW 2322 WILL OPEN THE FOLLOWING BEARISH TARGET
2290
EMA5 CROSS AND LOCK BELOW 2290 WILL OPEN THE FOLLOWING SWING RANGE
SWING RANGE
2274 - 2246
As always, we will keep you all updated with regular updates throughout the week and how we manage the active ideas and setups. Please don't forget to like, comment and follow to support us, we really appreciate it!
Mr Gold
GoldViewFX

Gold recovered slightly - XAU increased⭐️ Smart investment, Strong finance
⭐️ GOLDEN INFORMATION:
Gold price (XAU/USD) rises on Tuesday after hitting two-week lows of $2,325. The increase is supported by a weaker US Dollar (USD) and safe-haven demand due to geopolitical tensions in the Middle East. However, higher short-term Treasury yields and strong US economic data may strengthen the USD. Traders are cautious ahead of key US inflation data this week. The US Conference Board’s Consumer Confidence and speeches from Fed officials are scheduled for Tuesday. The US Core PCE Price Index on Friday will be closely watched. If there are more hawkish comments from the Fed and signs of persistent inflation, traders may reconsider expectations of a rate cut, leading to a stronger USD and downward pressure on gold prices.
⭐️ Personal comments NOVA:
Gold prices recovered slightly at the beginning of the week when there was not much important economic news, mainly sideways
⭐️ SET UP GOLD PRICE:
🔥BUY GOLD zone: $2334 - $2336 SL $2330 scalping
TP1: $2342
TP2: $2350
TP3: $2360
🔥BUY GOLD zone: $2309 - $2307 SL $2302
TP1: $2315
TP2: $2322
TP3: $2330
🔥SELL GOLD zone: $2378 - $2380 SL $2385
TP1: $2370
TP2: $2360
TP3: $2350
⭐️ Technical analysis:
Based on technical indicators EMA 34, EMA89 and support resistance areas to set up a reasonable BUY order.
⭐️ NOTE:
Note: Nova wishes traders to manage their capital well
- take the number of lots that match your capital
- Takeprofit equal to 4-6% of capital account
- Stoplose equal to 2-3% of capital account
- The winner is the one who sticks with the market the longest
