As mentioned in previous analysis, I believe the breaking of 60K to be important for BTC.
If it is important, we'd be in a bull trap now.
Currently we have to classic 76 retracement along with a butterfly correction pattern.
Trying a fairly large short on BTC now. Expressed through shorts on BTC directly, OTM puts on COIN and OTM puts on MSTR.
If the break is legit, I think we'll see 40K in BTC in the next swing.
Comment:
And one for the MSTR puts.


Comment:
Here are the signals that trigger the short and also I'll follow up with the ones I'd expect to see in a break.
Signal one is the 76 retracement. Bread and butter stuff for trend continuation. Most bull traps end at, or near to, the 76.
Trading off the 76 with a stop behind the last high is always a 1:3 RR trade for a retest of the low and always a 1>5 or more for a new low.
Making the strat profitable on a 22 - 35% win rate.

Comment:
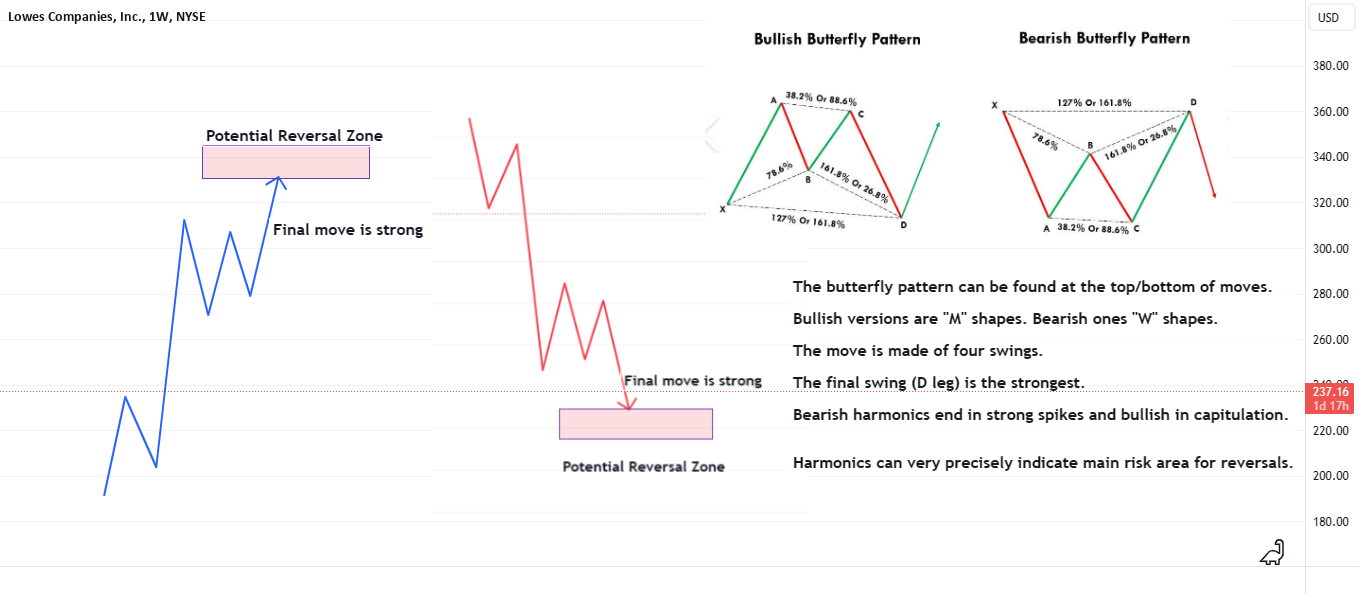
This is complimented by the butterfly continuation strategy. In this we'd look to see a parabolic D leg. The last bull move being the strongest.
Then the reversal to be stronger than the rally. The target forecast on this pattern is a 2.20 extension of the rally.
Then the reversal to be stronger than the rally. The target forecast on this pattern is a 2.20 extension of the rally.

Comment:
Most reversals will feature some sort of failed new high / double top and when this happens we can look for the failure of the bullish butterfly to signal a trend break (Failure of the bull trap).

Comment:
And if all these things happen, then we can use the 76 trend cont strategy in a slightly different way.
We can draw the fib for the trend cont level off the big rally:
If and when price gets there we move bear stops to even / small profit because this is where there's most risk of a bull move but if this area breaks, it's usually a good indicator for a move lower.
So we can do this to define our major uptrend failure level.
First one is the butterfly. Second one is the 76 fail.
Comment:
The above details the set of strats I use any time I am trading a possible reversal. Be it as a bull or bear.
Only thing I've not used here is the 1.61 head fake.
There's not been one of these. Makes me a bit paranoid there will be but at this point I can use this to determine my tightest stop losses.
I think most failed spikes end around 1.61 and do not break 2.20. So when we have a mini sell off I can fib this and use it to determine my tolerance area for spikes and when I think a true bull break has been made.
These rules I've found to work well in trading reversals in any market and on any time frame.
Only thing I've not used here is the 1.61 head fake.

There's not been one of these. Makes me a bit paranoid there will be but at this point I can use this to determine my tightest stop losses.
I think most failed spikes end around 1.61 and do not break 2.20. So when we have a mini sell off I can fib this and use it to determine my tolerance area for spikes and when I think a true bull break has been made.
These rules I've found to work well in trading reversals in any market and on any time frame.
Comment:
Just noticed the COIN post link isn't there. Instead I pasted something from a comment I was replying to. Mustn't have copied the link lol.
My bad. Here's the COIN link.
My bad. Here's the COIN link.

Comment:
When we have a confluence of the butterfly pattern completing inside of the expected area for a retracement (76 fib) I called this the "Death zone".
For reasons that will be apparent if the reversal works.
And if the reversal does not work, it's usually the death of my bearishness. Super strong confluence of short signals right now, if they fail - then it's wise to not be stubborn.
For reasons that will be apparent if the reversal works.
And if the reversal does not work, it's usually the death of my bearishness. Super strong confluence of short signals right now, if they fail - then it's wise to not be stubborn.
Comment:
The rules covered here are fractile. They work on all time frames.
As such, it's worth looking for small expression of them also in the potential reversal zone.
Here we have a 76 retracement. Suggesting the rejection is close or if this fails the spike out is much more likely.
I'm adding to my shorts here.
As such, it's worth looking for small expression of them also in the potential reversal zone.
Here we have a 76 retracement. Suggesting the rejection is close or if this fails the spike out is much more likely.
I'm adding to my shorts here.
Comment:
Now we have some selling we can use the 76 to define local break levels.
We're at the first one now.
We're at the first one now.
Comment:
It's bewildering that it's a clear fact BTC has dropped over 70% more than any major asset in history and, yet, when you forecast any sort of bear move people still tell you it won't happen because of X, Y or Z thing that was always also true during every 70% drawdown.
Utterly bewildering.
Utterly bewildering.
Comment:
Spike it is. And that completes the confluence of short signals.
Biggest positions on into the 1.61 spike.
Biggest positions on into the 1.61 spike.
Comment:
Comment:
Now we can repeat the 76 thing.
If we get to the 76, shorts from the high go to even since this is the risk area for a low. If it breaks, then the momentum is likely to switch to sellers.
If we get to the 76, shorts from the high go to even since this is the risk area for a low. If it breaks, then the momentum is likely to switch to sellers.
Comment:
76 retracement.
And if the 76 retracement works and produces a new low, 100% of the time you can then map out the pending harmonic discussed above.
And if the 76 retracement works and produces a new low, 100% of the time you can then map out the pending harmonic discussed above.
Comment:
Here's the current BTC chart alongside a template I drew up for market tops in mid 2021 (When I started my warning of a bear moves to come).
Comment:
We could currently be in this section.
Comment:
Taking a larger perspective, we may have already seen this phase happen on the higher timeframes.
In the template I said;
"These ranging properties look like "Bull flags" and other patterns that were previously bullish, and helps to further encourage retail investment into the last section of the move."
Did you see anyone mention a bull flag?
In the template I said;
"These ranging properties look like "Bull flags" and other patterns that were previously bullish, and helps to further encourage retail investment into the last section of the move."
Did you see anyone mention a bull flag?
Comment:
I noticed a lot of bearish posts in the top ideas here recently. Which does make me kinda nervous. In general when it's popular to be a bear I don't like being a bear. Parabolic bull traps are the norm.
However, after checking the updates on the posts now it seems most of them got stopped out around 63K.
I wonder if this is the end of the short squeeze.
However, after checking the updates on the posts now it seems most of them got stopped out around 63K.
I wonder if this is the end of the short squeeze.
Comment:
The concept there will usually be a bounce when it's publicly popular to be a bear is one of my golden rules of bearing.
Here's a post from mid 2021.
Here's a post from mid 2021.
Comment:
Note how we also have the conditions of the market moving very quickly to the resistance zone and then ranging for a long time.
When looking at this from only a bullish perspective this looks like bull flags etc but if you're a prepped bear you should expect both the market to range at the high for a long time and for it to be uncomfortable.
Everything that's happened so far are things one should generally expect in a top.
When looking at this from only a bullish perspective this looks like bull flags etc but if you're a prepped bear you should expect both the market to range at the high for a long time and for it to be uncomfortable.
Everything that's happened so far are things one should generally expect in a top.
Comment:
Spiking again. Hit even stops on previous entries from the high and replacing them now on the possible butterfly pattern.
Breaking of the 2.20 of this pattern would trigger stops for me.
Breaking of the 2.20 of this pattern would trigger stops for me.
Comment:
Strat info
Comment:
If the harmonic is actionable this should be the high and the rejection and selling should be strong once it gets underway.
Failure of the harmonic makes me nope out. Horrific things can happen when you bet on harmonics and they fail.
I'd rather get out early and then I can wait and see what happens and make a calm headed decision whether I want to try the short again if it looks like it was just a stop hunt or if I want to buy a retest of my failed short entry because I think a true break is made.
Big action area now.
Trade active:
Have big shorts on now. I always take my biggest trades closest to the failure point of the setups.
When I have the least distance to my stops and the biggest target area.
Full position fill at 64K.
When I have the least distance to my stops and the biggest target area.
Full position fill at 64K.
Comment:
A problem with BTC shorts is it's very stop hunty. Which makes things tricky. Because if you're right you have to have some more tolerance for spike outs to get paid and in the times you're wrong this means you have to lose more. Both of of these things degrade the RR of the trade.
You lose more on your losers and win less on your winners.
This is why in the OP I said I was expressing my bet with some BTC shorts but also buying the puts on related stocks. That worked out so much better at the BTC high. BTC was fighty at the high but MSTR dropped 25% the day after I bought puts on it.
Using ETH as a proxy short is also good. So far ETH perfectly complies with all the bull trap norms.

Comment:
We have the 76 top and and currently chopping around the 50.
All textbook stuff.
All textbook stuff.
Trade active:
Here's the ETH trade
Comment:
Picked up large shorts into the rally. Both in BTC and took a bit bigger shorts in ETH.
Respective stops are;
BTC 65,200
ETH 32,200
BTC has made the full 76 retracement of the last drop.
In my view, that means it's now or never for the bears.
Short should become easy from here on and if it's not easy, I'm not short.
Real spirited effort at the short into these major resistance levels though.
Comment:
If this turns out to be a simple full swing 76 reversal I'm going to feel a bit naive for shorting a little too early because this will be bread and butter stuff.
Can easily top tick these setups if it's a simple reversal and all I had to do was be patient and I could have bet bigger.
But still do have my biggest bets on at the 76.
Can easily top tick these setups if it's a simple reversal and all I had to do was be patient and I could have bet bigger.
But still do have my biggest bets on at the 76.
Comment:
There's all the criteria spoken of earlier in the post.
A 76 top. Sharp reversal. Breaking of the pending harmonic support.
A 76 top. Sharp reversal. Breaking of the pending harmonic support.
Comment:
This makes the next sequence in the pattern to fib low to high of the rally and if we get to the 76 move stops on shorts from the high to even because this is the big risk area for a bullish continuation.
If the 76 fails, this is often the second sign of bull trend failure. We have a failure of an extremely strong trend on the butterfly break and we have a complete failure of the local uptrend on a 76 break.
If the 76 fails, this is often the second sign of bull trend failure. We have a failure of an extremely strong trend on the butterfly break and we have a complete failure of the local uptrend on a 76 break.
Comment:
The spike high currently is contained to the 1.61 of the range. Which is inside of the expected head fake we see in final stop runs.
Lot of things line up for the short here. Quit point is also very clear now.
There's a fine line between being persistent and being stubborn. We've reached that line.
Lot of things line up for the short here. Quit point is also very clear now.
There's a fine line between being persistent and being stubborn. We've reached that line.
Comment:
Bear flag breaking gives really good odds the 76 will fill.
Here's the common bear/bull paths off a 76. I have stops to even on the larger part of my positions entered at the high now.
Here's the common bear/bull paths off a 76. I have stops to even on the larger part of my positions entered at the high now.
Comment:
76 does fill. Decision level now.
Comment:
Support failure would also trigger another failed butterfly.
All things point to an imminent low or a strong move down once the break is made.
My trading bias is towards the break and my trading decisions are based on protecting myself from the rally.
Stops trailed and patient while a decision is being made.
All things point to an imminent low or a strong move down once the break is made.
My trading bias is towards the break and my trading decisions are based on protecting myself from the rally.
Stops trailed and patient while a decision is being made.
Comment:
We have a reaction on the 76 but this has more of a dead cat feel to it than a legit bull move. Too early to tell and only time will definitively tell but I've not yet seen any of the things I generally dislike seeing as a bear.
Shallow range is fine. Need to see a break soon though.
Shallow range is fine. Need to see a break soon though.
Comment:
All of this currently fits nicely into the EW theory.

Comment:
If I'd bought supports I'd usually be puking my longs now because I don't expect us to get this low again in a strong bull move. Drawn in is the entry/stop and expected path I'm used to in these types of setups.
I didn't buy support. This is just a strat note for the 76 cont strat
Being back at these levels is generally bad news for bulls. Usually only a matter of time before it breaks.
I didn't buy support. This is just a strat note for the 76 cont strat
Being back at these levels is generally bad news for bulls. Usually only a matter of time before it breaks.
Comment:
Stops to above the last major high now.
This feels like a break coming but if it is it shouldn't trade back up there again. If we trade there something else is happening.
If it's a break, bull are trapped in the spike and about to get yanked. Just a matter of time.
This feels like a break coming but if it is it shouldn't trade back up there again. If we trade there something else is happening.
If it's a break, bull are trapped in the spike and about to get yanked. Just a matter of time.
Comment:
Okay 20 hours since the 76 hit and we've still not managed to break it.
We're now on the 61. Another pending support level but if this one breaks I suspect we'll end up seeing the rally rejecting.
We're now on the 61. Another pending support level but if this one breaks I suspect we'll end up seeing the rally rejecting.
Comment:
We now have another pending butterfly pattern (And this should happen. As time goes on the same pattern appear on bigger charts).
So here we have another clear break level and another level at which we have pending support so once we get close to it we can trail our stops on the shorts.
This is a really good way to trade a reversal. Always be looking for the bullish patterns so you know where to the risk of it turning against you is.
In a situation like this I like to think like a bull and trade like a bear. I'll keep looking for the spots I'd buy as a bull and protect my short profits there. Similarly, I'll look for the spots I'd stop out as a bull and these levels will encourage further bearishness. Perhaps position adds.
Comment:
BTC has actually consistently down trended now for 2 months.
Here's a post taking a deeper look at all the warning signs of a big break coming.
Here's a post taking a deeper look at all the warning signs of a big break coming.

Comment:
A bit of a rally but again it meets sellers inside of the levels the strats proposed would forecast.
The 76 trade:
The 76 trade:
Comment:
Harmonic correction.
Comment:
And now the pending harmonic break to solidify bears being in control.
Comment:
Took more shorts on ETH. Here's the case for a big decline in ETH.

Comment:
Spiking again.
This is where the mindset of "Think bull trade bear" pays dividends. Because a few updates ago we clearly defined where the bear break levels was and instead a low was made around this level. It's not what my trade was looking for, but it's not a shock. My trailing stops hit and I can replan.
I think this is perhaps just going to be a head fake stop hunt. So I'm setting limit orders to short a little higher above the previous. Still around the 76 and stop still over 86.
Stopping out of shorts and selling again higher is a good thing. You make more and lose less doing that. It's much better than randomly holding losers.
It's popular these days to act like that's not so, but these people have a thinking problem. Don't listen to them. Do your own thinking.
Trade active:
Limits filled and adding more positions now. Stop hunt vibes are strong.
Unfortunately I don't specific rules/strats for this like the other things in the thread. If I am right here it's just because I've had my stops hunted a lot.
Or maybe I'm just wrong. Not long to find out now.
Big positions on again.
Unfortunately I don't specific rules/strats for this like the other things in the thread. If I am right here it's just because I've had my stops hunted a lot.
Or maybe I'm just wrong. Not long to find out now.
Big positions on again.
Comment:
Okay so recent short entry holds as the high for now.
The important thing for the bear setup here is we hold the higher lows structure and produce a new low.
Little head fakes here and there are important to strategical positions but in a broad analysis sense, all we have to do is hold the lower high structure.
Read detailed analysis of this here:
The important thing for the bear setup here is we hold the higher lows structure and produce a new low.
Little head fakes here and there are important to strategical positions but in a broad analysis sense, all we have to do is hold the lower high structure.
Read detailed analysis of this here:
Comment:
This post has made it to the top of the ideas page, which means we should expect the quality of the comments to take a sharp dive. Unfortunately, that's how it works here.
Comment:
There are a lot of bad narratives on how people should trade these days.
Popular comments on sites like this would lead you to believe you should be ashamed of yourself if you have anything other than 100% win rate.
Go speak to 100 traders who really made some money, every one of them will tell you this is nonsense.
Most successful traders bat at about 40 - 60% win rate and just make money on the positive RR.
They strive for a set process. A simple set of rules. Not jumping from one thing to another. Not randomly adjusting their levels.
They have a repeatable process than they know has a net edge and they execute on that consistently.
Remember when assessing ideas on social media, 100% of people tend to act like they're successful traders - but we know for a fact from brokerage strat over 70% fail.
A lot more posers than traders out there.
Read this for more info on building real trade plans:

Comment:
Google "FXCM study on losing traders"
FXCM is a large Forex broker. They ran a study on 54 million trades by their clients (Good sample size).
They found most people had a net negative result in dollar terms but they had a positive win rate.
They won more trades than they lost, but they did not control their losses on their losing trades and thus ended up losing money overall.
If you take the time to really look into it, you'll see those promoting the idea stops are a bad thing are almost certainly either LAARPs (Not trading at all) or inexperienced - because they'll find out later this is a bad idea.
Comment:
Spiking again.
When markets spike out of ranges you need a way to aim to differentiate a breakout from a false breakout.
My personal rules are to look for false breakouts to end by 1.61 extensions.
And/or the butterfly spike out pattern.
So here I fade the spike and if these signals fail it's generally a really bad look for the bear trade. Often I'll consider reversal. Certainly stop out and plan places I'd like to short higher if I still want to short.
PS - The people who do not read the thread before commenting are arriving. Brace yourself for the same comment many times in the comments section.
Comment:
Here's it all together and the stop loss on this setup.
Comment:
That's what we look for in a false breakout. Sharp return to the break.
Stops to even now we're at support and will wait and see if I get paid.
This looks quite legit, but only time will tell.
Stops to even now we're at support and will wait and see if I get paid.
This looks quite legit, but only time will tell.
Comment:
I think we've covered all we have to cover here for at least a while.
Spikes back to the short entry would be ugly for the short setup and trigger an exit at break even stops.
If the trade is going to work, the take profit will not be for a considerable amount of time and we'd be looking for a few more supports to break to trail stops more.
The break thesis would be that we've just completed wave C of the correction and are now in new downtrend legs.
Read the full case for the downtrend by clicking the link below:
Comment:
We now have a couple of the phases we often see before a reversal.
Firstly we've broken the uptrend structure and we now have a possible two leg W bull trap.
For context on this break pattern, here's the same thing before the previous big bear move.
Here it is in the local chart.
So here we'd be looking for the recent spike to be a false breakout. False breakouts here should run just enough to bring in breakout buyers, but not enough to pay them.
Comment:
The break example cited isn't hindsight magic. Here's a forecast from the time of this break setting up the lower lows drop to 16K.

Comment:
There's a lot of mentions from people who seem generally bullish of a mild drop possible if we break lows again.
I think a mild drop on a new low would seem extremely unlikely.
A new low triggers the failure of the bullish butterfly.
Can be various bounces along the way, but the target for the broken butterfly is somewhere in the 40K area.
Bulls are looking for various different depths of "Dip". But right now what they're facing is a rejection at an attempt to make a new high and now pending uptrend failure on the weekly chart.
Over the last months I've written dozens of posts to support the bear thesis and knock down the common bull points.
It's taken a long time. I'd not have done it to warn of a dip.
I think we're facing potential bull trend failure.
Hard to understate how ugly that could become.
Comment:
I don't profess to know the future. I've done this a long time and I know I won't get everything right. When I am right, I'll usually be very accurate. When not, I'll usually have a good escape planned.
But what I do know is there's a whole army of people out there who've been caught out by every BTC sell there's been, including this one, and are talking extremely confidently about where this one will end.
That is irrational, and I'd also suggest that may be a warning.
But what I do know is there's a whole army of people out there who've been caught out by every BTC sell there's been, including this one, and are talking extremely confidently about where this one will end.
That is irrational, and I'd also suggest that may be a warning.
Comment:
I'd like to keep this post focused on the local break pattern development and points at which we protect bear trades along the way rather than get too much into larger scope things.
Larger scope moves are covered in this thread:
Larger scope moves are covered in this thread:
Comment:
Good developments for bears. Early requirements of the false breakout are in. Traded just enough above resis to look like a break but not enough to make it worth taking action on. Classic thing we see in a stop hunt/liquidity trap.
We're now at the 76 level. Which is where we make our trailing stop decisions.
The previous high is now what I call either the "Effective high" or "My high". What I mean is IDK if it will or won't be the high, but the highest I am willing to tolerate. It's the effective high for me because my short would be over above it.
My rational here is if this is a low rather than a bear break, then I have the possible structure of a harmonic. This could mean I am "Essentially right" about the reversal - but a sharp spike to above my last entry would come.
Since I think even in a bearish setup a higher high relative to my entry would be made, I want to protect my short profits with a trailing stop right above where the local lower high structure would fail.
If the bear trade from this level is good, then the spike out should be complete.
Patience as a bear is well warranted here, a break could be very strong.
Comment:
I think a good thing to take away from the things discussed in this thread is the concept of it's when the market is down and it looks like I am right is when I am most proactively preparing for things that can happen if I am wrong.
Every time I feel good about the trade based on recent price action, I take steps to protect myself against it going bad on me.
How often do you see people bragging about their running wins only for that to the exact point the market turns? It's no mistake. The market will make you feel clever right before it's about to make you look stupid.
When you feel like bragging, do things to protect your position instead.
I think, strongly, a bear break is coming. But tactically I need to know all the things I'll do if it rallies instead. That's where my focus has to be. I already know what I'll do if I'm right.
Comment:
All still looks good.
The previously mentioned support was a low but the rally off it didn't break the downtrend structure or hit the trailing stop.
This rally was rejected with consistent hour after hour selling.
New low was made. Currently held a retest.
If we're in wave 3 now we should see mainly shallow rallies and lower lows/lower highs. Probably an odd two leg bull trap here and there but mostly simple bear trend continuation patterns.
Comment:
Fairly strong chance of a bit of a bounce here. Should hold lower highs if the trend is good.
Comment:
Maybe not as high. This might be it here. Parabolic rally to 76 of recent down move.
Comment:
Looks like a classic bull trap rally so far.
Super strong and fast. Scary action for bears.
Goes to the 76.
Breaks a local resistance which is good for stop hunting bears and/or sucking in breakout traders.
Now we're looking for the strong rejection.
Super strong and fast. Scary action for bears.
Goes to the 76.
Breaks a local resistance which is good for stop hunting bears and/or sucking in breakout traders.
Now we're looking for the strong rejection.
Comment:
Trailing stops on high entries and adding shorts here.
Comment:
Looks like support break has been solidified.
That gives us the butterfly high.
Common at the end of a correction.
Since we've looking for a trend to hold lower highs and lower lows, stops are all trailed to behind the last high.
That gives us the butterfly high.
Common at the end of a correction.
Since we've looking for a trend to hold lower highs and lower lows, stops are all trailed to behind the last high.
Comment:
Could be another bull trap leg coming.
Trailed stops on recent entries to above the last high and placed pending orders to short a little higher.
Locking in some net profit if I end up being wrong on the downtrend but keeping me in shorts if lower lows keep being made. Increasing net profit if the sell limits fill and succeed.
Trailed stops on recent entries to above the last high and placed pending orders to short a little higher.
Locking in some net profit if I end up being wrong on the downtrend but keeping me in shorts if lower lows keep being made. Increasing net profit if the sell limits fill and succeed.
Comment:
Possible trend cont level.
Comment:
Sorry for no updates. Been busy last couple days. Things remain looking good for bears. There was a larger bull trap but it held inside of the fib retracement levels and maintained the lower high structure.
We have a bounce off 60K. 60K I think really is the actionable level here. In the bear move this will be a dead cat. Short term vicious bull move but stronger bear move on the break.
High of the recent bigger rally is now the invalidation point for shorts. Lower highs should hold in the downtrend.
Now there's been a big stop run / bull trap - it should be fairly plain sailing again for bears if the trend is valid.
Comment:
Looking at the bounce, again using the rules of being more cautious about bigger bounces or reversals at 76s would have helped here.
Also, the fact we're under the low of that move is a really bad look for the bull move, imo. If I had got long support the new low would have triggered my stop here.
A good strong bull trend should have followed through. Shallow dips, not a big slam to a new low.
Bad look for the bull move.
Bias strongly towards shallow bull trap and bigger bear break.
I think the odds firmly favour a lower for the year now. And if that happens, I don't see any major support until 45 then 40K.
Comment:
I think this might be the end of the bull trap.
Short entry and limit order as bit higher in case this is a little too early.
Short entry and limit order as bit higher in case this is a little too early.
Comment:
Upper sell filled. First one went a bit into profit but was a false start. Bigger shorts on here.
If we see a strong rejection here then I think the break is made and I find it hard to see any strong case for a low above 40K. I'd think somewhere in that area even in a bullish setup.
In a bearish one, it can get worse after.
If we see a strong rejection here then I think the break is made and I find it hard to see any strong case for a low above 40K. I'd think somewhere in that area even in a bullish setup.
In a bearish one, it can get worse after.
Comment:
Stops trailed at the 76
Comment:
Trailing stops hit. New limits filled at the 76 retracement. Same trading pattern as discussed previously.
Comment:
I feel sorry for people learning about markets in the current times. So often people act as if the way you should aim to be is committed to an idea, act like that idea is infallible and have a 100% success rate or you're an idiot.
I've been doing this a long time and it used to be the case most people would tell you thinking like that made you an idiot. What you need is a repeatable process. An edge to make money in the markets. Then you need to repeat it a lot of times. Multiple instances make a net result.
It was easier to learn this when I was new to trading. This was regarded as common sense. Now, not so much.
Comment:
The above idea is why I present myself the same whether I'm hitting swings highs to low or getting nailed on every setup.
I'm just using a consistent set of rules. The winning trades don't make me smart and the losing ones don't make me dumb. Whether or not the sets of rules make a profit over multiple trades is the determining factor.
When you understand probabilities and bet on enough things in the market you know eventually you'll experience all outcomes. Once this is understood it's illogical to tie feelings of pride and shame to trade outcomes. There'll be a distribution of outcomes.
This perspective seems to be rarer these days. With a more favourable one being to believe you're smart and anyone not always making the same bet as you is dumb.
To each their own, I suppose. Time will test both methodologies.
Comment:
Full fill on this 76.
Rather encouraged by the emergence of trolls again. Trolls can often mistime the market better than I can time it. True story.
We're using the 76 strat here for entries and stops.
Rather encouraged by the emergence of trolls again. Trolls can often mistime the market better than I can time it. True story.
We're using the 76 strat here for entries and stops.
Comment:
Shorting while this much off a high is always a tricky spot. One one hand, there's a strong tendency for a market to reverse starting with a steady sloping off with big rallies and head into a capitulation break - and it's generally about this far off the high we tend to transition to that.
On the other hand, this is where there's a lot of risks. For the moment let's leave out the risk of just being wrong. Let's talk about the risk of being correct on a bear thesis of price trading under 20K but a tiny little bit off on where the high was to be made.
In the times there's a final spike here, the risk is it goes to the 1.61 of the pullback range and this is the fastest and strongest part of the uptrend.
A huge jump-scare move.
Isn't fun being short during that. Really good idea to try a short after that but you'll not want to do that if you get caught in shorts too early.
A risk to always be afraid of when fading a big trend is you're 90% right. If you're 90% right then you're liable to run into big problems. Especially in something like a head and shoulders setup.
Here if you do not think about the spike risk what invariably happens is you accumulate shorts into the drop and are spiked out of them at the high.
If this breaks through the next levels of resis then there's a good case this is a inv head and shoulders low made.
I'd previously mentioned we'd broken the butterfly level but if this is contained inside of a known spike out pattern (HS and is one of those) then it was maybe just a spike out.
I'm going to be persistent in the execution of the high RR short entries on obvious resistances but absolutely not going to be stubborn if resistances break.
If the bear trade is good, once it's done running the stops and encouraging the bull breakout traders, it should be an easy short. If it's not an easy short, it's probably not working.
If we spike, I'd estimate my next area of interest for a short is around 90K.
This isn't a bullish spike forecast (Yet). Just being proactive in explaining risks to shorts and rational for shorting at 90K if we happened to go their quickly.
Comment:
Looking at the considerations for bullish breakout. Usually we hit the 1.27. Pullback to retest the break and then break the 1.61. The breaking of the 1.61 starts the stronger uptrend.
If this happens there'll be ample opportunity to buy at essentially the same price later.
If we breakout and pullback off the 1.27, I'll buy there. Will cover more on reasons why if the move happens.
This plan attempts to be prepped for a bear break now, a spike out and reversal and joining a new bullish breakout at a timely spot.
In theory at least. We'll see how it does in application.
Comment:
A lot of comments recently seem to be demanding I admit my strategies are all nonsense now because stops hit.
I'm still happy enough to agree they do not have 100% win rate. I think I've shown my forecast win rate and RR to accurate over multiple instances.
I'm still happy enough to agree they do not have 100% win rate. I think I've shown my forecast win rate and RR to accurate over multiple instances.
Trade active:
ETH still following downtrend norms. 5 waves down. Butterfly correction. 76 retracement.
New ETH entries here.
Note: Failure of the butterfly continuation here is a strong hint of failure of downtrend.
New ETH entries here.
Note: Failure of the butterfly continuation here is a strong hint of failure of downtrend.
Comment:
A couple comments ago I mentioned the inverted head and shoulders. Here's why this is not default bullish for a new high here.
The head and shoulders is widely known as a reversal pattern. And they do happen at extreme highs and lows. However, it's also very commonly a corrective pattern. Crashes or parabolic runs come off of them but they do not break the previous trend.
When we look at the Elliot model we can see it actually predicts this.
The formation of waves 4, 5 and B have to make a head and shoulders like pattern.
The head and shoulders signals a strong move - and that strong move is expressed in the Elliot wave C leg (Always a capitulation or parabolic leg).
However, in the EW model the strong move coming out of this actual signals the end of the correction rather than a new high.
As such, we're always going to see these type of moves correcting a trend. They're very good to get on while the right shoulder is forming - but much more risky at this stage in development when we're actual a new a pending reversal level.
Comment:
Stop loss management for the trade if we get a sell off is as follows;
We fib low to high of the most recent rally to the top. If and when we get to the 76 fib we protect our short profits because most lows come around 76s. If that breaks hits 86, holds a retest of 76 and breaks 86 we trail our stops to behind that 76.
Once the above has happened that swing is done. The process is repeated for the bigger swings.
Comment:
The theory here is bullish continuation should come from a strong clean rip off the 76. Breaking that often immediately bull traps but is more commonly trend continuation.
If we're betting on trend continuation, we have to be betting on lower highs. Once a new relative high is established, this dictates we should trail our stops to behind it.
If we're betting on trend continuation, we have to be betting on lower highs. Once a new relative high is established, this dictates we should trail our stops to behind it.
Comment:
Here's an example of this in the recent ETH 1 min chart.
The 76/86 broke. We hit the 1.27. The 76 held a retest.
Here a clear new high point has been established and this is the trailing stop point. This same concept can be applied on increasingly larger timeframes if the trade develops.
The 76/86 broke. We hit the 1.27. The 76 held a retest.
Here a clear new high point has been established and this is the trailing stop point. This same concept can be applied on increasingly larger timeframes if the trade develops.
Comment:
Using the very smallest swing BTC is testing the 76 now.
Comment:
Here's the small chart action on the area of interest.
We hit this and attempted the blue path. Nice wick candle into and out of the 76 and then bullish momentum.
We didn't manage to maintain the momentum and have now retested the 76.
I often find this skews more towards a bear break. Double bottoms after a big attempted bounce are rarer.
This looks more like the chop action shown in the red path.
Comment:
Common continuation pattern here is down to the 1.27 and then a bounce to retest the break.
Momentum builds on break of 1.61.
These are the same breakout norms given for a bullish breakout and BTD and also the ones for the real time ETH example.
Momentum builds on break of 1.61.
These are the same breakout norms given for a bullish breakout and BTD and also the ones for the real time ETH example.
Comment:
This basic template can be applied to progressively bigger swings if the downtrend develops and also has a strong chance of giving you foresight warning of where the lows will be if the downtrend fails.
The sequence of rules/norms here can be used to build bigger bear roadmaps if the 76s continuate to break and if there's going to be a failure of the bear trend most of the time it'll be around a 76 which we know is our biggest risk spot.
I use this set of rules to trade reversals in many different types of markets. They're really effective if a downtrend does develop and provide timely exits if not.
Comment:
Red path
This triggers the trailing stop rules.
This triggers the trailing stop rules.
Comment:
Retracement zone filled. This is where we should see the bear continuation is the retest of the break is to hold.
Comment:
Here we can do multiple things. We can plan the break move as per the norms;
We can plan next optimal short levels if this produces a spike.
We've already established the trailing stop level. So here we can actually benefit from the spike by having a chance to short higher with a tighter stop and wider profit scope.
Failure of the local bear patterns can be mapped in and used as bullish reversal levels for the possible spike (Which is likely. I find so often entries on Sat will end up spiking later).
Comment:
Gartley pattern. One of the earliest harmonic patterns. From 1940 or something.
The full range of harmonics we have today evolved from this.
(I have to say, I've found it to be one the lesser reliable harmonics in modern times).
The full range of harmonics we have today evolved from this.
(I have to say, I've found it to be one the lesser reliable harmonics in modern times).
Comment:
*1935, apparently. Around the same time Elliot was doing his thing. During the Depression.
You can Google "Gartley 202" if you're the type that likes to know all the background.
If not, this is a Gartley pattern.
Can be a good continuation pattern.
Strong breakout. Initially retracement. Spike out of that retracement. New low.
Specific fib ratios can be found looking into the pattern in more detail.
Thank you for your posts, I like reading them. Thumbs up.